DASHBOARD
The dashboard, which is the first page opened after logging into the system, is the area where the findings about the corporate / organization and the visual graphics of the data collected by all modules . The first graphic , corporate / organization at the top of the page is the area where information from all modules of Pentestbx and risks are calculated and displayed.
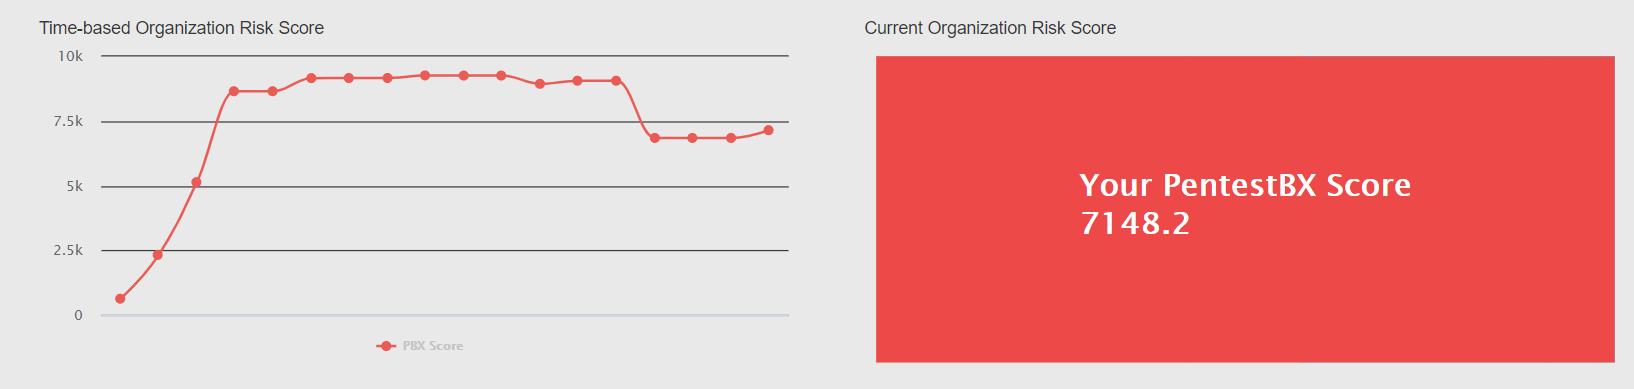
It is possible to see corporate / organization risk level chronological data on this graph.
The graphic below is an overview of the “Systems” module that monitors the weaknesses and services of IP addresses defined in the Pentestbx system.
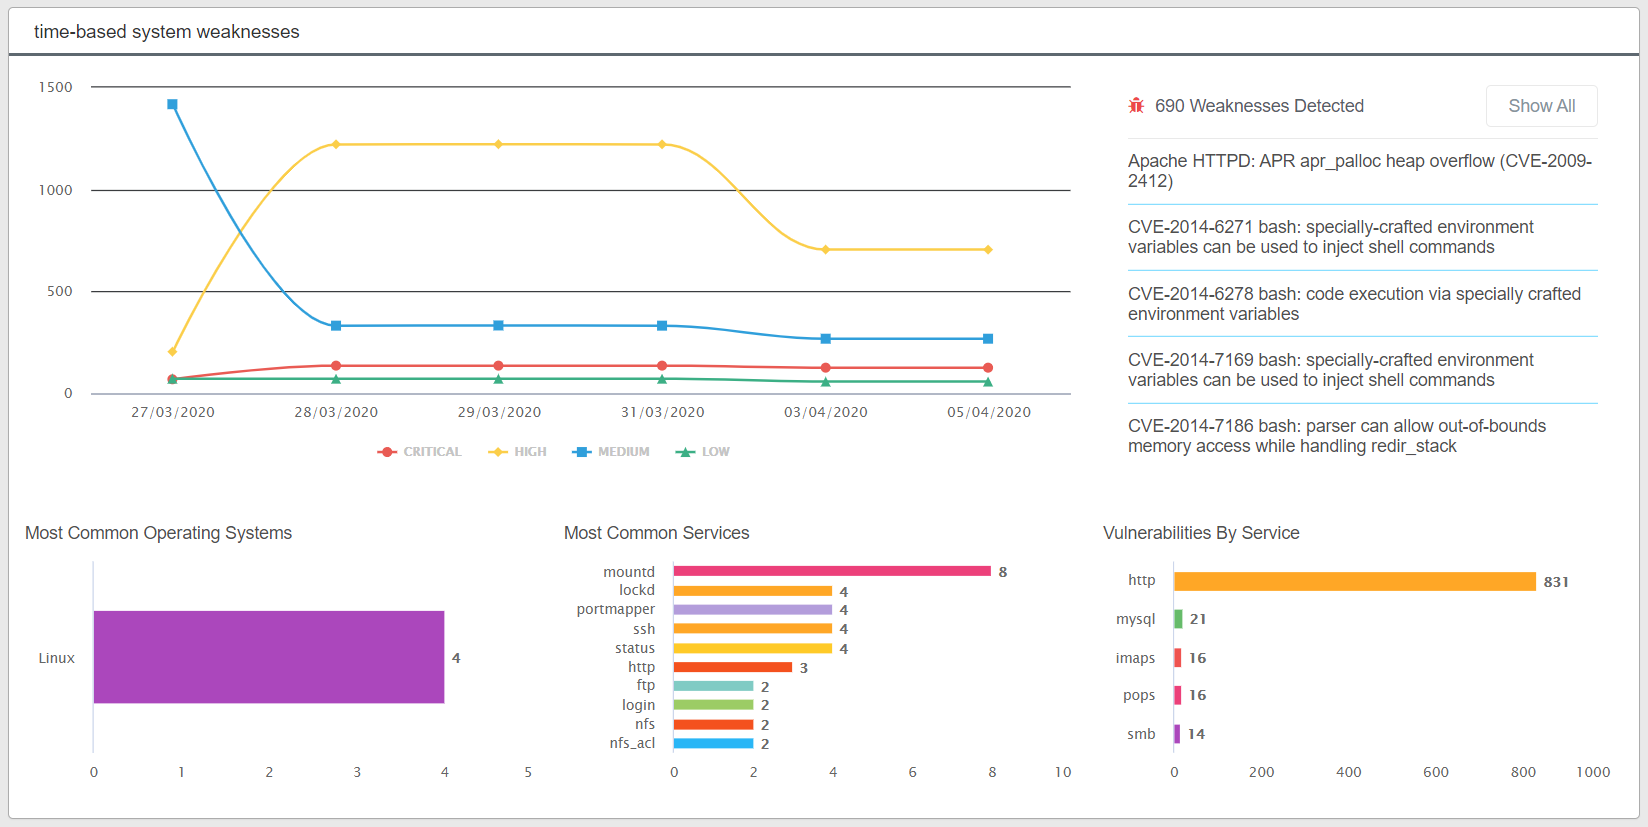
The weaknesses obtained during the scans can be viewed on this graphic image. It is possible to see the numbers of the most detected operating systems, services and weaknesses.
This graphic below provides visualization of the weaknesses from the “Web Application” module and the weaknesses detected as a result of scans.
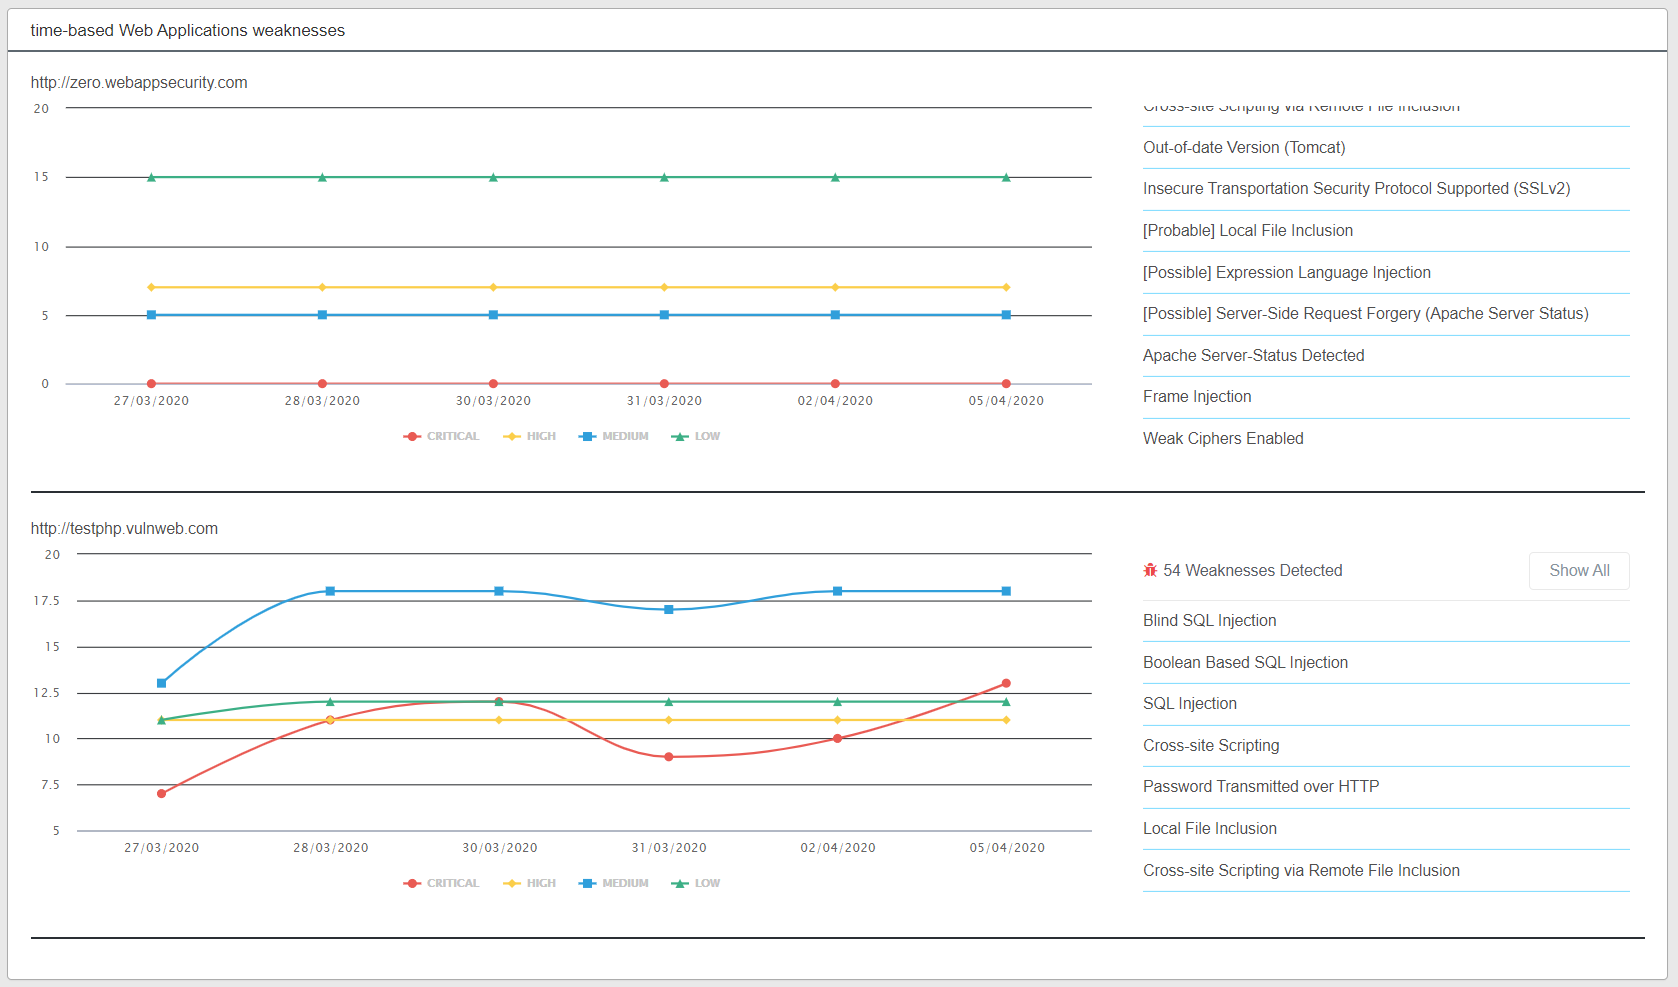
If there is more than one Web Application, the graphic is repeated for each web application.